Cash-Flow Diagrams
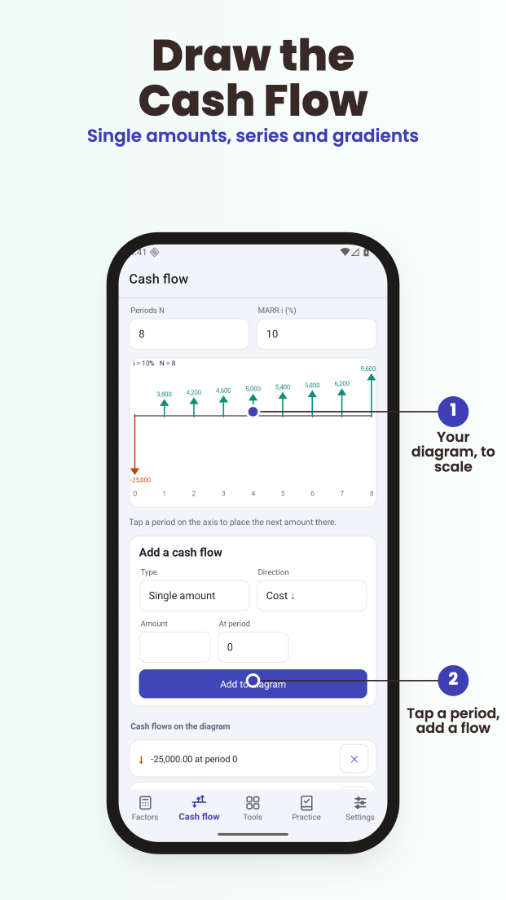
Enter any series of cash flows and see them drawn as a proper timeline diagram — the same format your textbook and professor use.
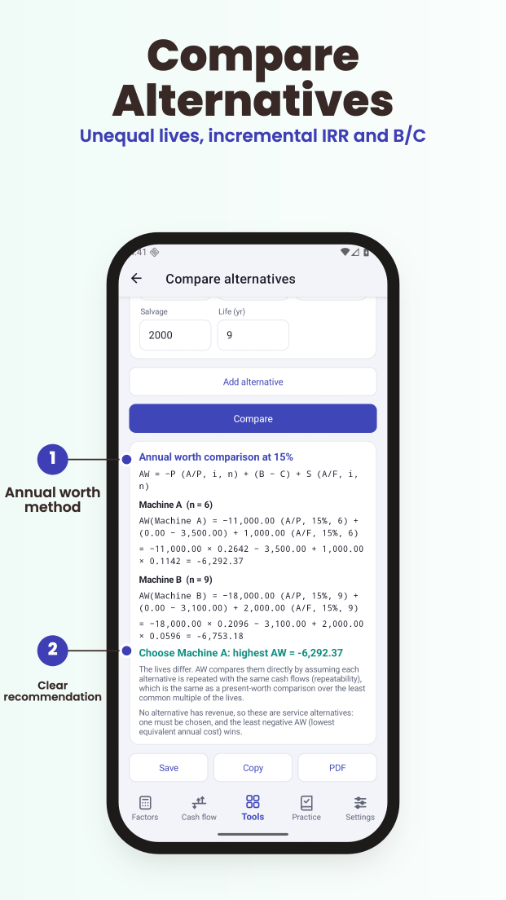
Cashplot draws cash-flow diagrams and works through every problem in textbook factor notation — P/A, F/P, NPV, IRR, depreciation — with no internet required.

Enter any series of cash flows and see them drawn as a proper timeline diagram — the same format your textbook and professor use.
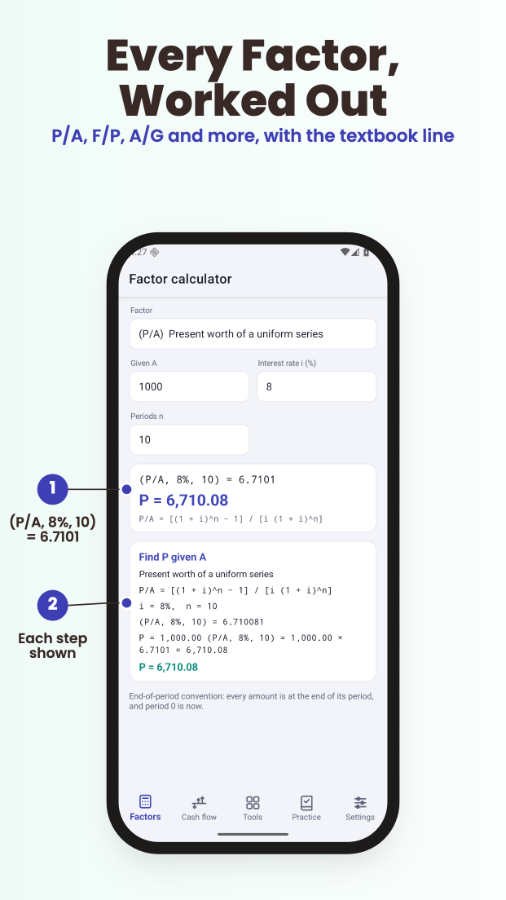
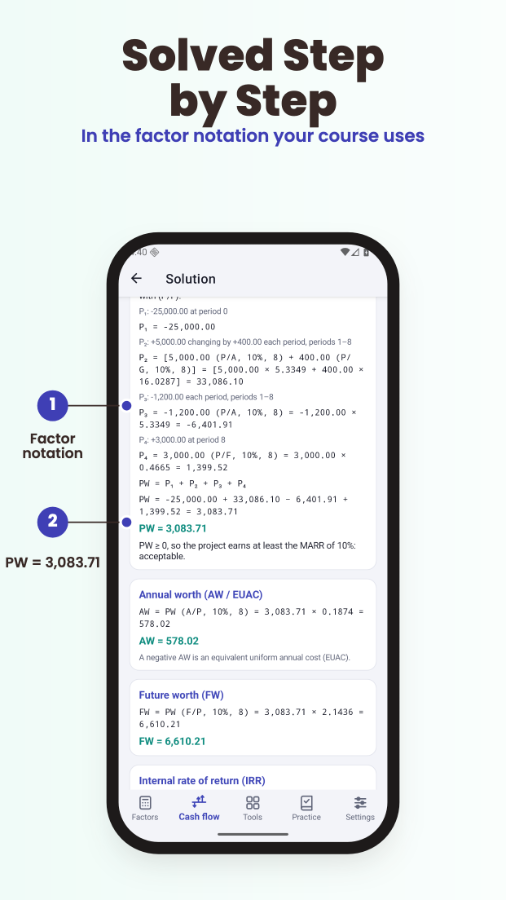
Every solution is written in standard notation: (P/A, i%, n), (F/P, i%, n), (P/G, i%, n), and others — exactly as your course expects.
Compute net present value for any cash-flow series at a given interest rate, with each discounting step shown in full.
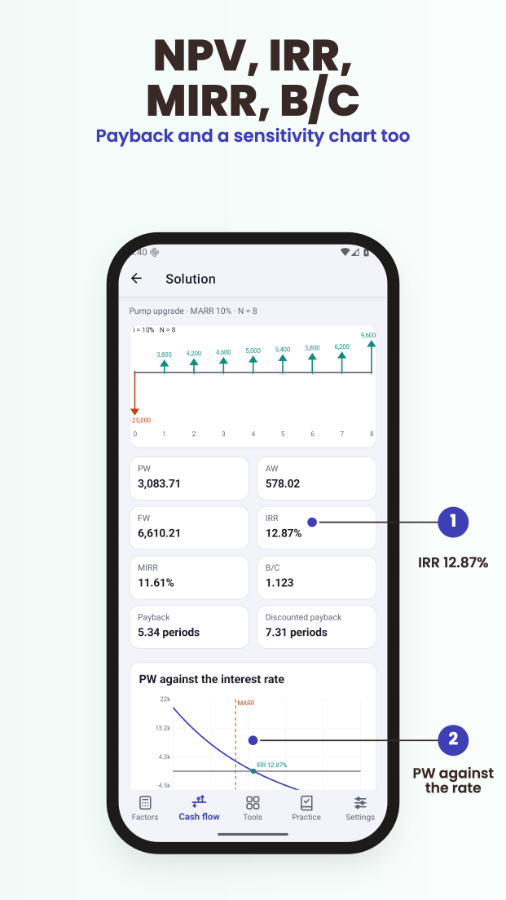
Find the internal rate of return without manual trial-and-error. Cashplot iterates to the solution and shows the logic at each step.
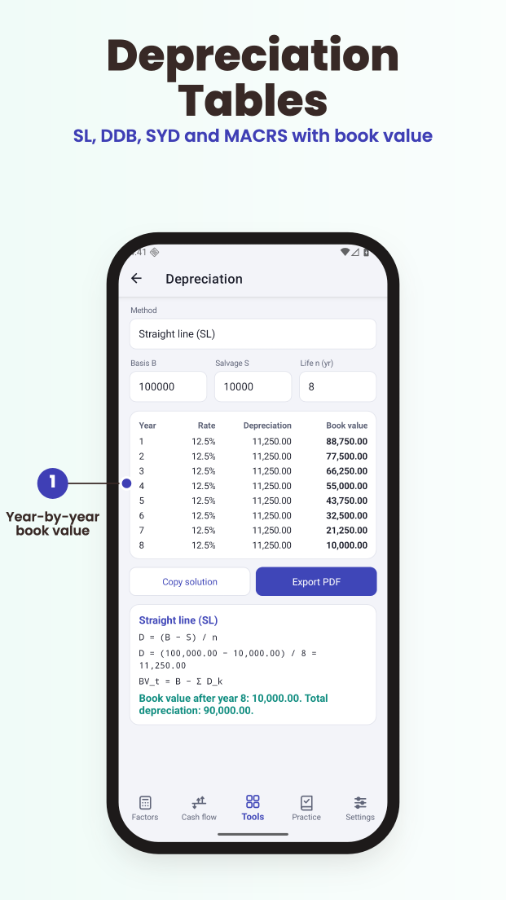
Work through straight-line, declining-balance, and sum-of-years-digits depreciation with a complete year-by-year table for each method.
No account, no internet connection, no sync required. All calculations run on your device, so you can study anywhere.
Cashplot is free to download and use. A small banner ad is shown while you work.
A one-time purchase removes all ads permanently. No subscription, no renewal — pay once and the ads are gone.
Covers the core topics of a standard engineering economics syllabus: time value of money, equivalence, rate of return analysis, and depreciation.